Context
Prompt:
How might we make healthy behavior change more viscerally rewarding and immediate?
Approach
Insight:
Self-tracking can change behavior, but becoming healthy is an emotional journey, not just a physical change. Users need more than cold, clinical charts and graphs to stay motivated.
Solutions:
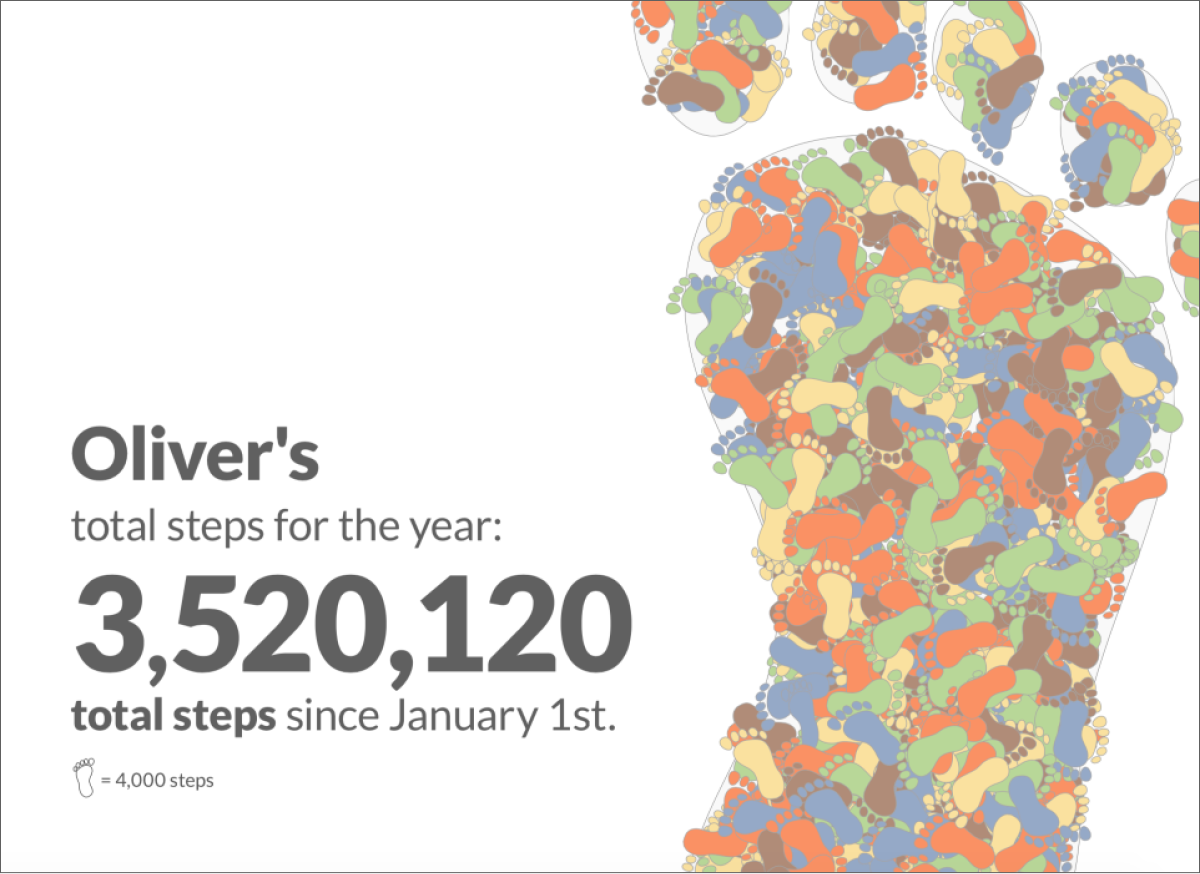
- Designed, developed and launched Notch.me MVP to encourage healthier behavior through visualization self-tracking data.
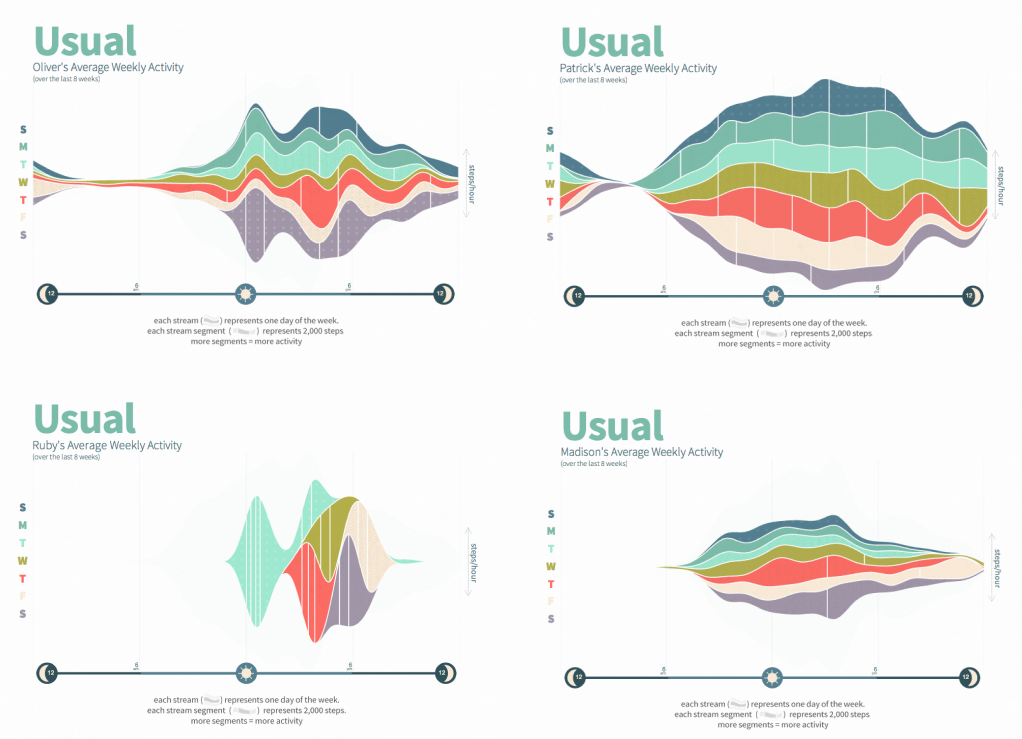
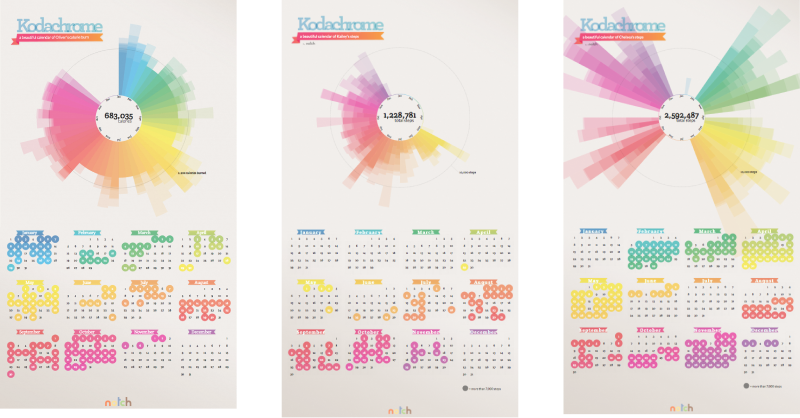
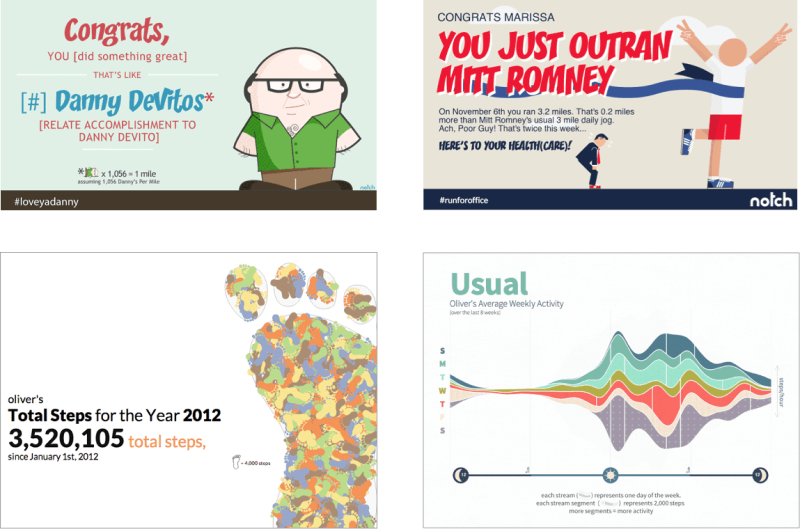
- Designed a series of shareable, dynamic data visualizations, letting users visualize their behavior and consider different aspects of health.
- Developed syncing service to integrate with leading tracking devices (e.g. Fitbit).
Results
- Tens of thousands of users generated and shared hundreds of thousands of personalized data visualizations
- Featured on TechCrunch and PandoDaily
“There’s something sort of rock star about a gorgeously designed infographic created about something so personal and banal as how many steps you took today.”
“Until I saw your graphics and your ‘result stories,’ I really wasn’t that dissatisfied. Now I want to view all of my data this way.”