Introduction
Contents:
What is a data visualization app?
There are 3 types of dataviz applications:
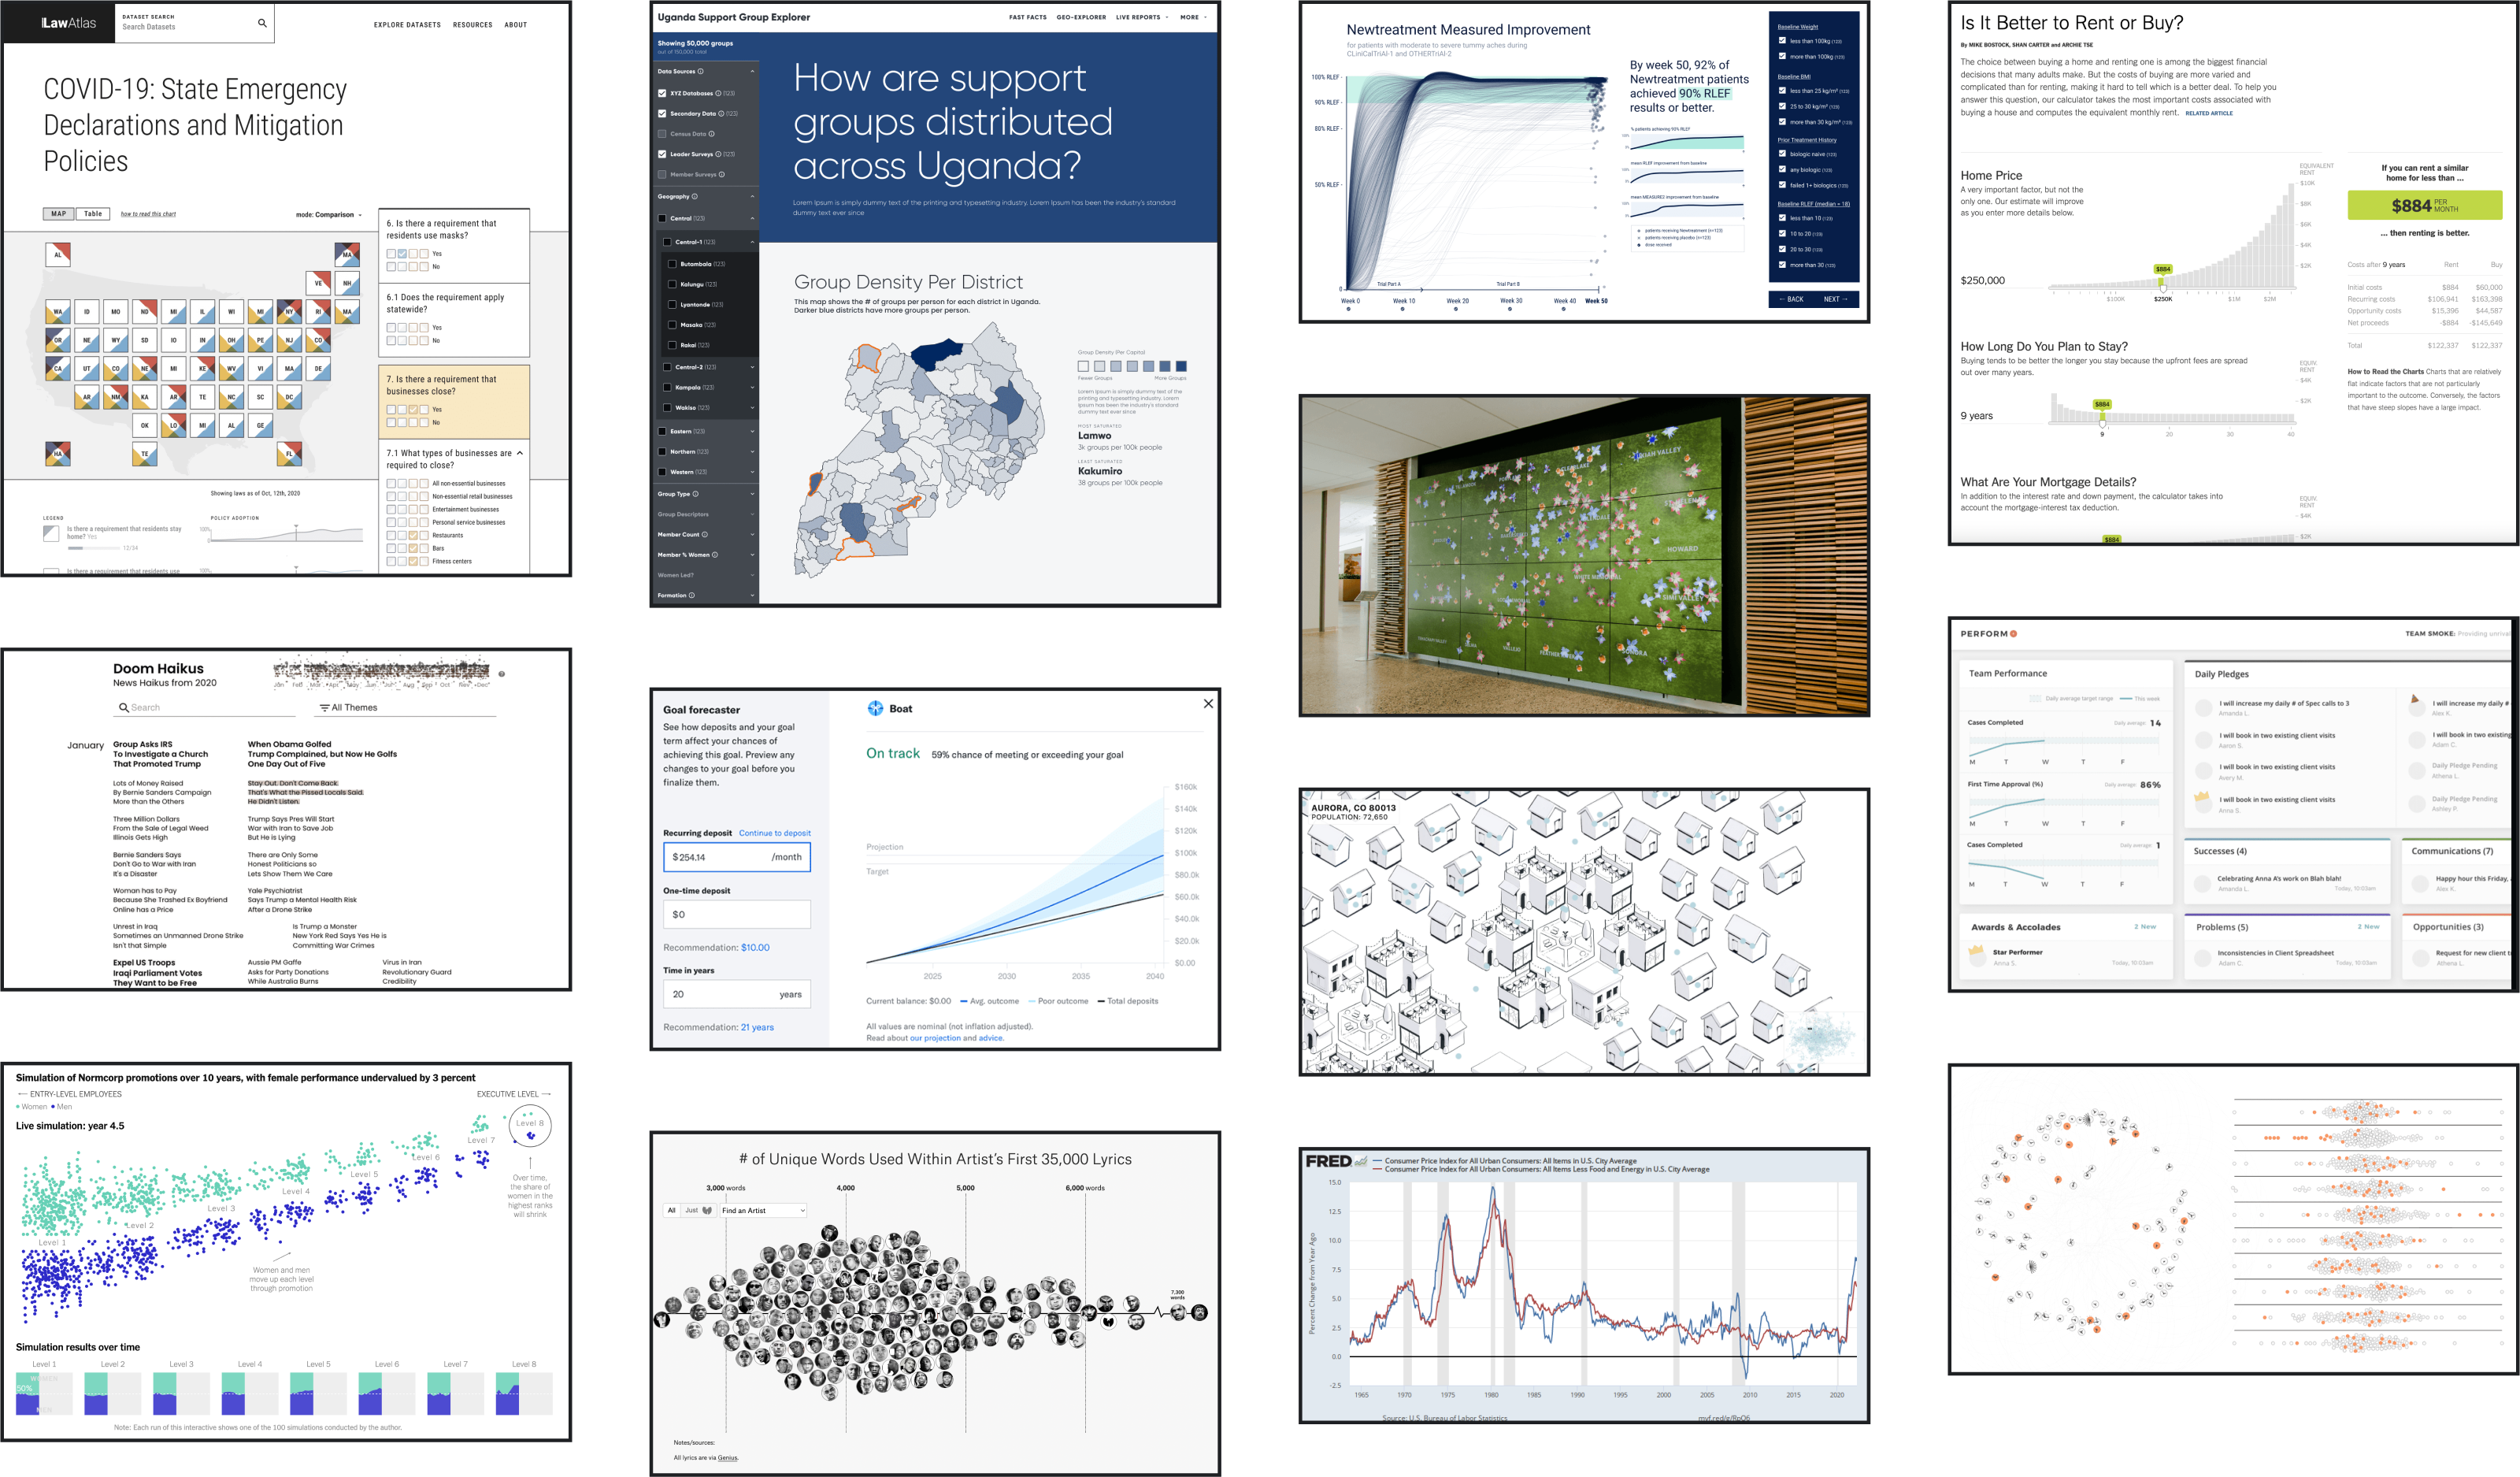
- Storytelling dataviz apps, typically focused on a narrative, aimed at educating and raising awareness around the most important findings or insights in a dataset. These often come in the form of web-based, linear scrollytelling experiences.
- Data exploration apps focus on flexibility, helping audiences use dataset(s) to answer a potentially infinite, long-tail of questions. This turns dense data into a resource that non-savvy consumers can use for general reference, or very advanced users can use for complex analysis. These are typically web-based and let users slice, dice, and visualize data in a variety of ways.
- Calculators and simulators help audiences “experience” datasets or complex models. This approach is particularly valuable when helping users make analytically difficult decisions or understand complicated social or natural phenomena.
You can learn more about different types of dataviz apps here.
How long does it take to build a custom data visualization app?

In a recent study published in DVS Nightingale, 3iap analyzed the time required for 10 major dataviz projects that we designed and / or developed for clients. Design and engineering take up most of the time (>60%), with the remainder going to research, analysis, and client communication.
Design time for a few representative examples of dataviz applications:
- Complex Dataset Exploration Tool: 14 days of design
- Interactive Scientific Storytelling App: 3 days
- Analytics Product Design System: 6 days
- Complex Survey Exploration Tool: 8 days
Engineering time for a few representative examples were:
- In-Product Chart Component: 8 days of engineering
- Scrollytelling Interactive Infographic: 11 days
- Interactive Scientific Storytelling App: 13 days
- Interactive Content Explorer: 7 days
In this study, overall project time requirements varied between 7 and 26 days. This range represents small to medium sized projects, while larger projects might be scoped more like traditional software product development (e.g. 2-3 people, working 2-3 months, or 80 - 160 days on a tightly focused minimum viable product).
What are typical rates for data visualization design and development service providers?
Whether the contract is time and materials, a project fee, or even value-based pricing, the underlying math is still based on a target daily rate (or hourly, or weekly).
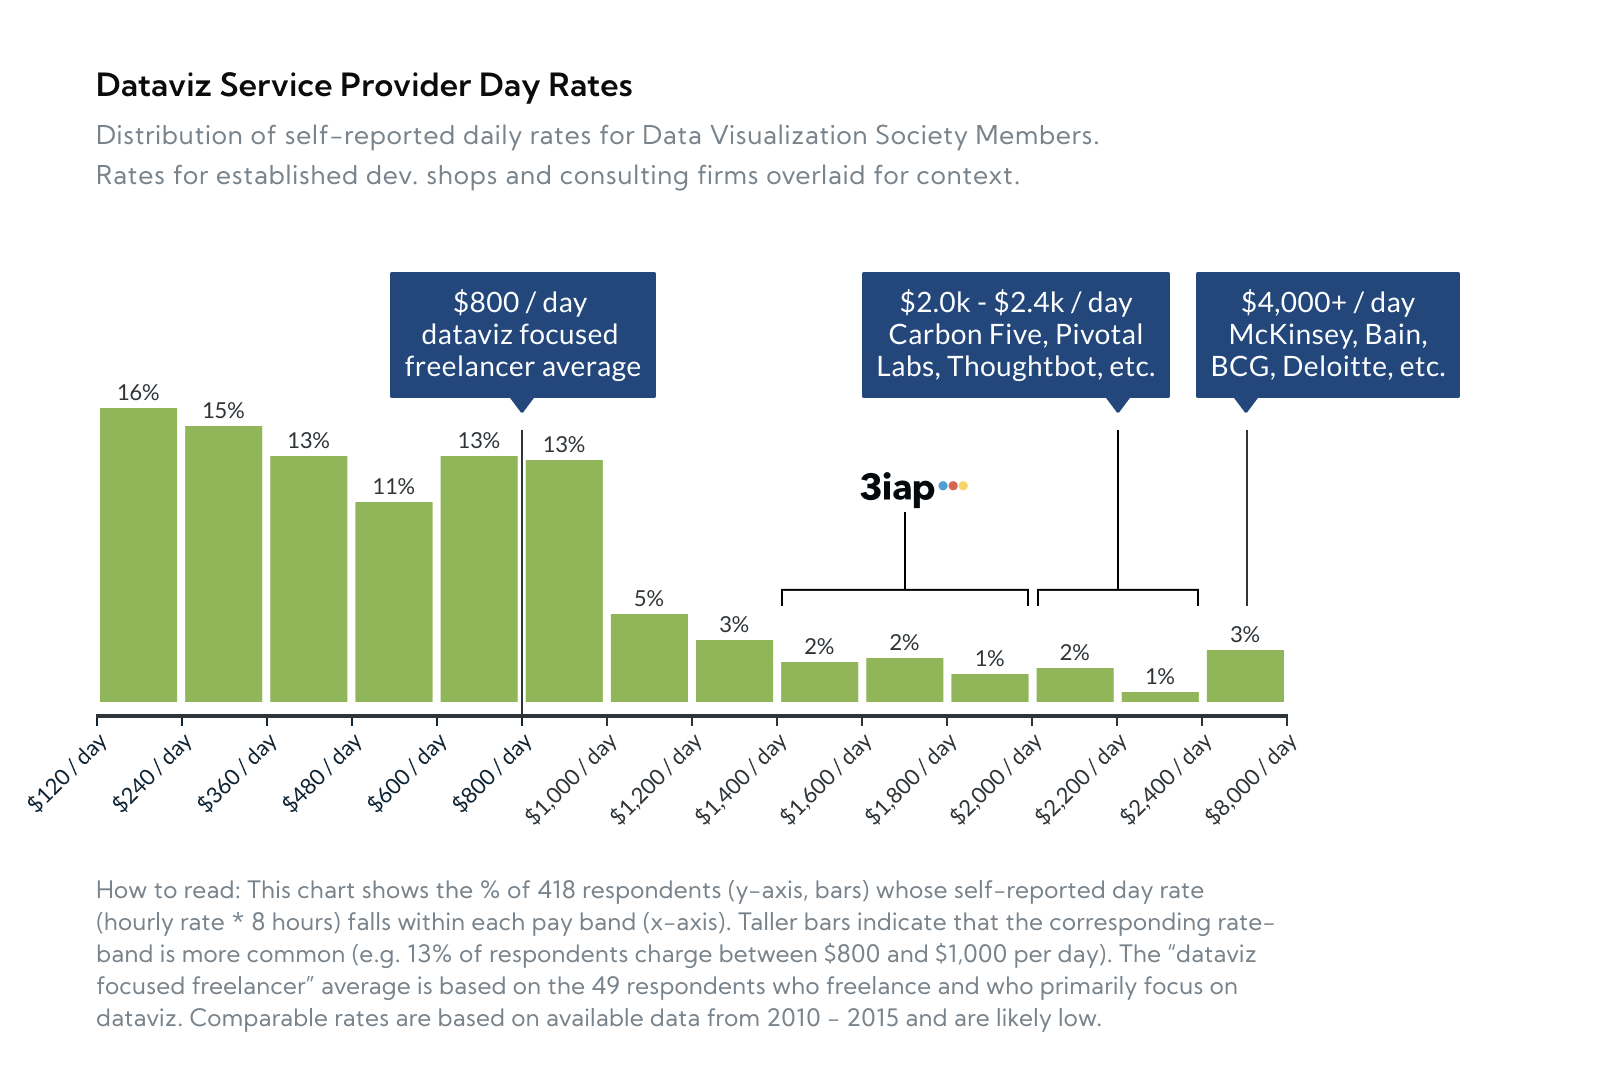
According to the Data Visualization Society’s recent industry survey, data visualization freelancers charge an average rate of $800 / day (or roughly $100 / hour). This average represents members across a wide spectrum of experience and expertise. While freelancers might seem like an economical choice, this comes at a risk to the overall timeline and often requires working across multiple contributors to meet the full set of capabilities (analysis, design, and engineering are typically distinct disciplines).
For comparison, more established firms typically charge 2-3x this rate, presumably for increased certainty around quality, timeline, and delivery. While generalist software design / development agencies (e.g. Carbon Five, Thoughtbot, etc) should generally be avoided for data visualization projects (dataviz, as a discipline, can be deceptively difficult to get right), they’re a reasonable benchmark for fees you might find from the industry’s best data visualization firms, who often charge between $2,000 - $2,400 per day.
At $1,400 - $2,000 per day, 3iap’s rates are somewhere in the middle. This reflects similar quality and capabilities as established firms, but as a small practice, 3iap has minimal overhead and the flexibility to work with startups and smaller, mission-oriented organizations.
What is a typical cost to build a dataviz app?
For small to medium sized dataviz projects (e.g. see work samples), we might expect between 7 and 40 days of work, so overall project costs might be:
- At consulting firm rates (e.g. McKinsey, Bain, BCG, Deloitte) rates: $28k - $160k
- For a typical dataviz design and development firm: $18k - $96k
- For a team of freelancers: $5.6k - $32k (note: this might seem like a steal, but remember the risks mentioned above)
For larger projects, combining dataviz and general software development, we might expect 80 - 160 days of work across a small team, with cost estimates as follows:
- At giant consulting shop rates: $300k - $700k
- For a typical dataviz design and development firm: $200k - $400k