
Must Be A Tuesday: Affect, Attribution, and Geographic Variability in Equity-Oriented Visualizations of Population Health Disparities
Collaboration with Lace Padilla, examining equitable data design techniques for population mortality charts.
Dispersion vs Disparity: Hiding Variability Can Encourage Stereotyping When Visualizing Social Outcomes
Collaboration with Cindy Xiong Bearfield, exploring the impact of variability on attribution and stereotypes.
Polarizing Political Polls: How Visual
Collaboration with Cindy Xiong Bearfield, exploring how social normative influences are triggered by charts.
Wokeness is a problem in the United States. Specifically, Americans aren’t nearly woke enough, and this lack of wokeness could be our undoing. Social misbeliefs aren’t just dangerous for the people being misunderstood, they put everyone at risk, undermining health, education, economic progress, and democracy itself. In this context, woke dataviz isn’t just about ethics or efficacy: it’s a matter of self-preservation.
In this talk, we’ll explore the surprising interplay between data design and social cognition. We’ll consider how visual rhetoric influences perceptions, how those perceptions support broader social narratives, and how those narratives, in turn, shape our reality.

Good dataviz is good writing.

Legitimizing myths support the status quo through complacency.
Use data to educate about social determinants of health, wealth and education.
Harmful stereotypes harm everyone by undermining collective action.
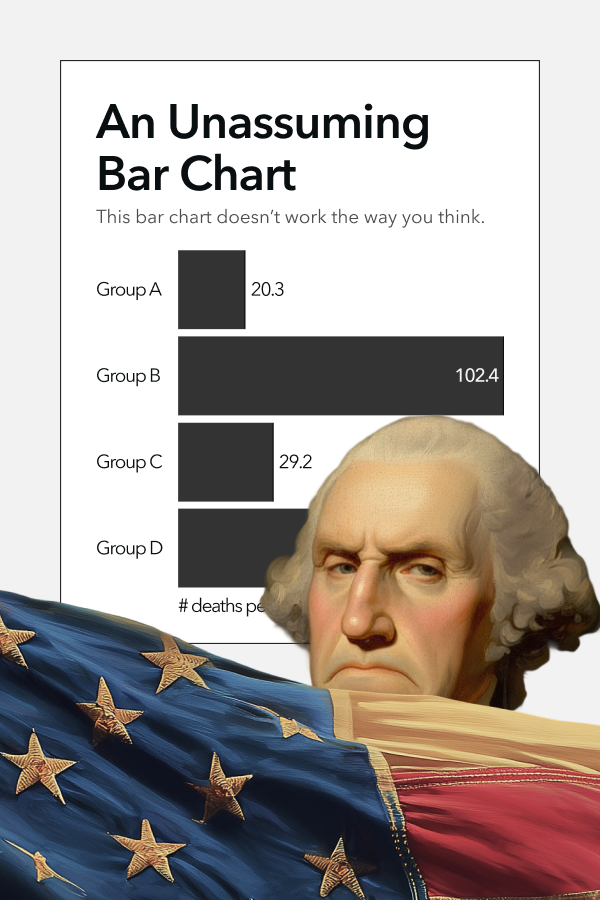
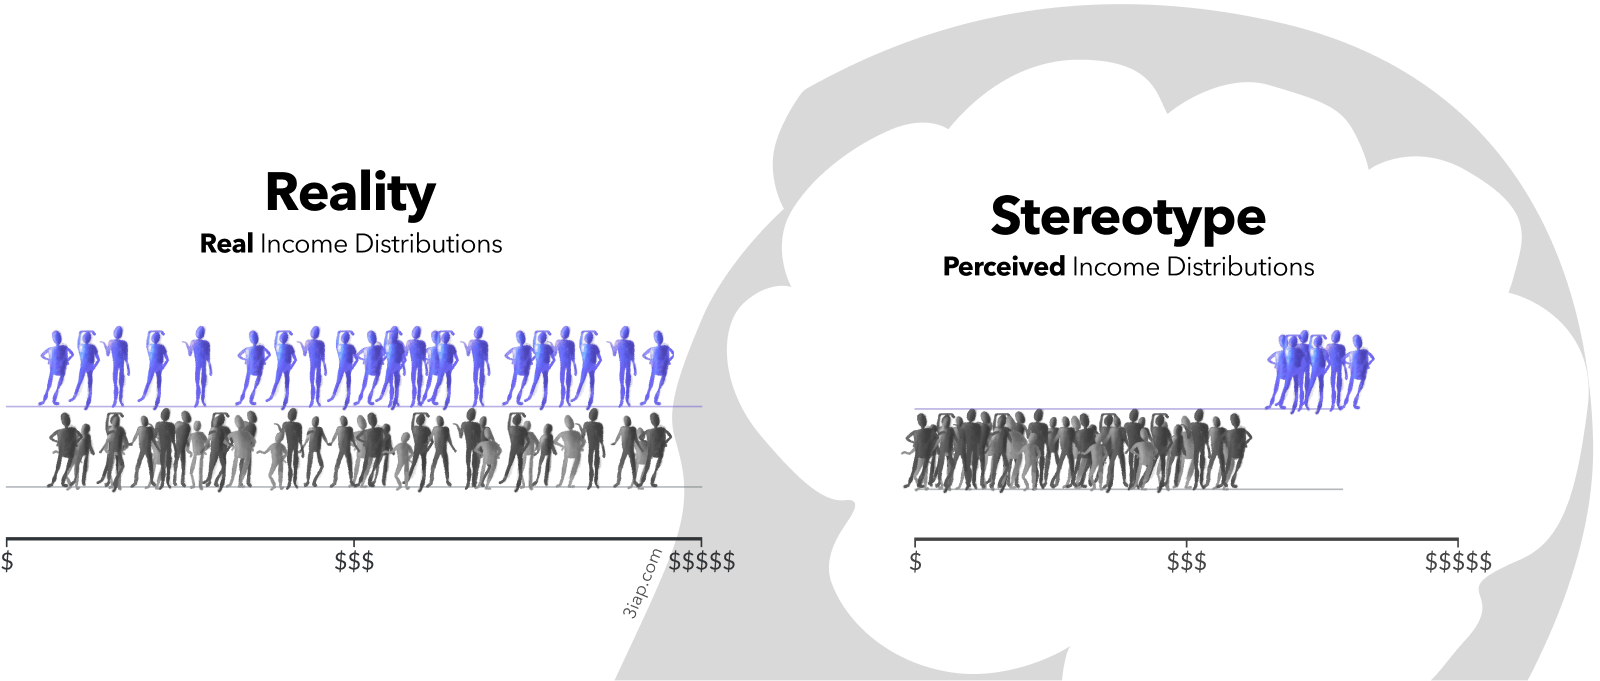
Hiding outcome variability promotes harmful stereotypes and misattributions about the groups being visualized.
Charts that stereotype one group, hurt everyone by undermining collective action.
Stereotypes are built on the perception of clean boundaries between different groups of people. If we want to live in a world that has nice things, we need to figure out ways to break down those boundaries.

Charts can be threatening!
Winning the attention game incentivizes drama.
Are there other engaging frames that aren’t oppositional or threatening?