Context
Client
The ETS Research Institute.
Prompt
How might we redesign The Nation’s Report Card reporting to clearly, effectively visualize student achievement across the United States?
Background
ETS researchers approached 3iap with an ambitious goal: Redesigning reporting for “The Nation’s Report Card.”
The Nation’s Report Card is the US federal government’s gold-standard data covering student achievement. The “report card” is how the US National Center for Educational Statistics (NCES) publishes the highly-anticipated National Assessment of Educational Progress (NAEP) student test results.
NAEP reporting is an important test case, informing an even broader ambition to ultimately improve reporting for any large-scale student assessments. Making these results more useful for informing policies is key to improving learning outcomes for all students.
About NAEP and The Nation’s Report Card
NAEP data is the United States’ most authoritative signal on student achievement, for the country as a whole and across all fifty states.
It’s not just foundational for education research, it’s also how state-level education leaders keep tabs on each other. A state’s rise (or fall) in NAEP rankings is a closely-watched signal for validating their education policies. Similarly, a drop in NAEP scores can be a motivating force to rally political support for changes and improvements.
NAEP data is also crucial for understanding group-level educational outcomes in the United States.
Design
Challenge
Because NAEP data disaggregates outcomes across student subpopulations, it gives us visibility into how students’ differences in opportunity manifest as differences in outcomes.
The challenge is that when charts show “differences in outcomes,” it makes “differences in opportunities” easy to overlook. And this can lead viewers toward some surprising misjudgments about the data.
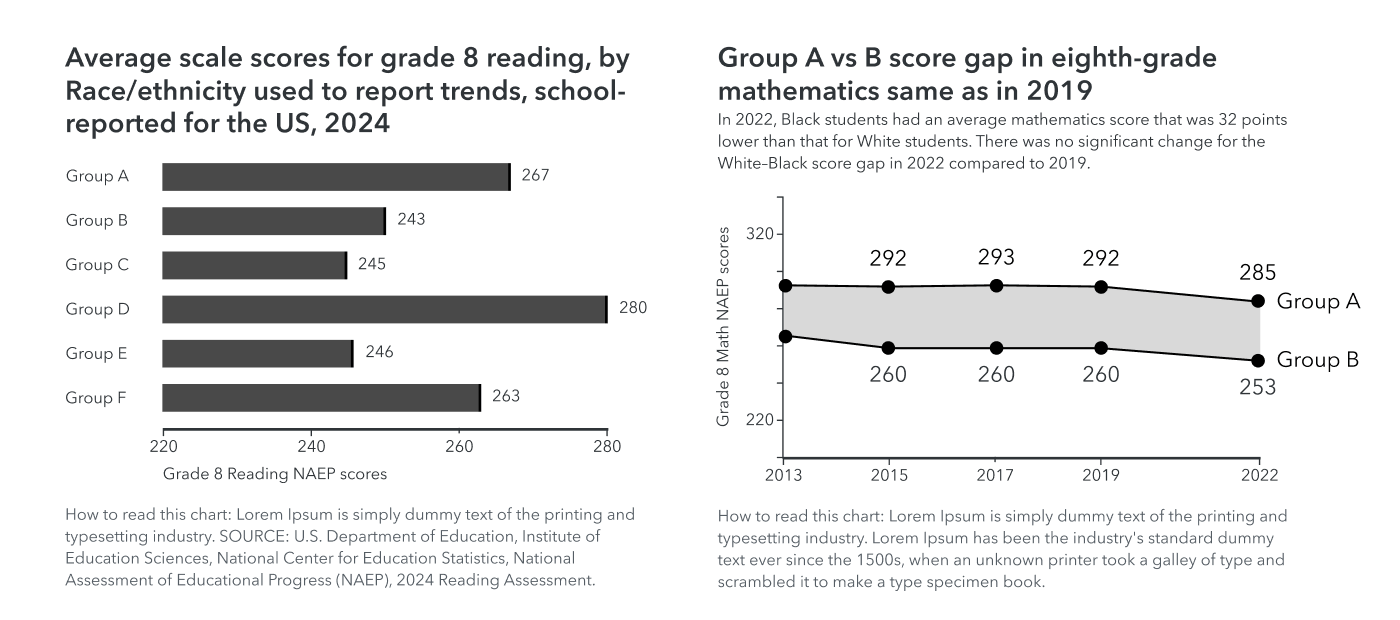
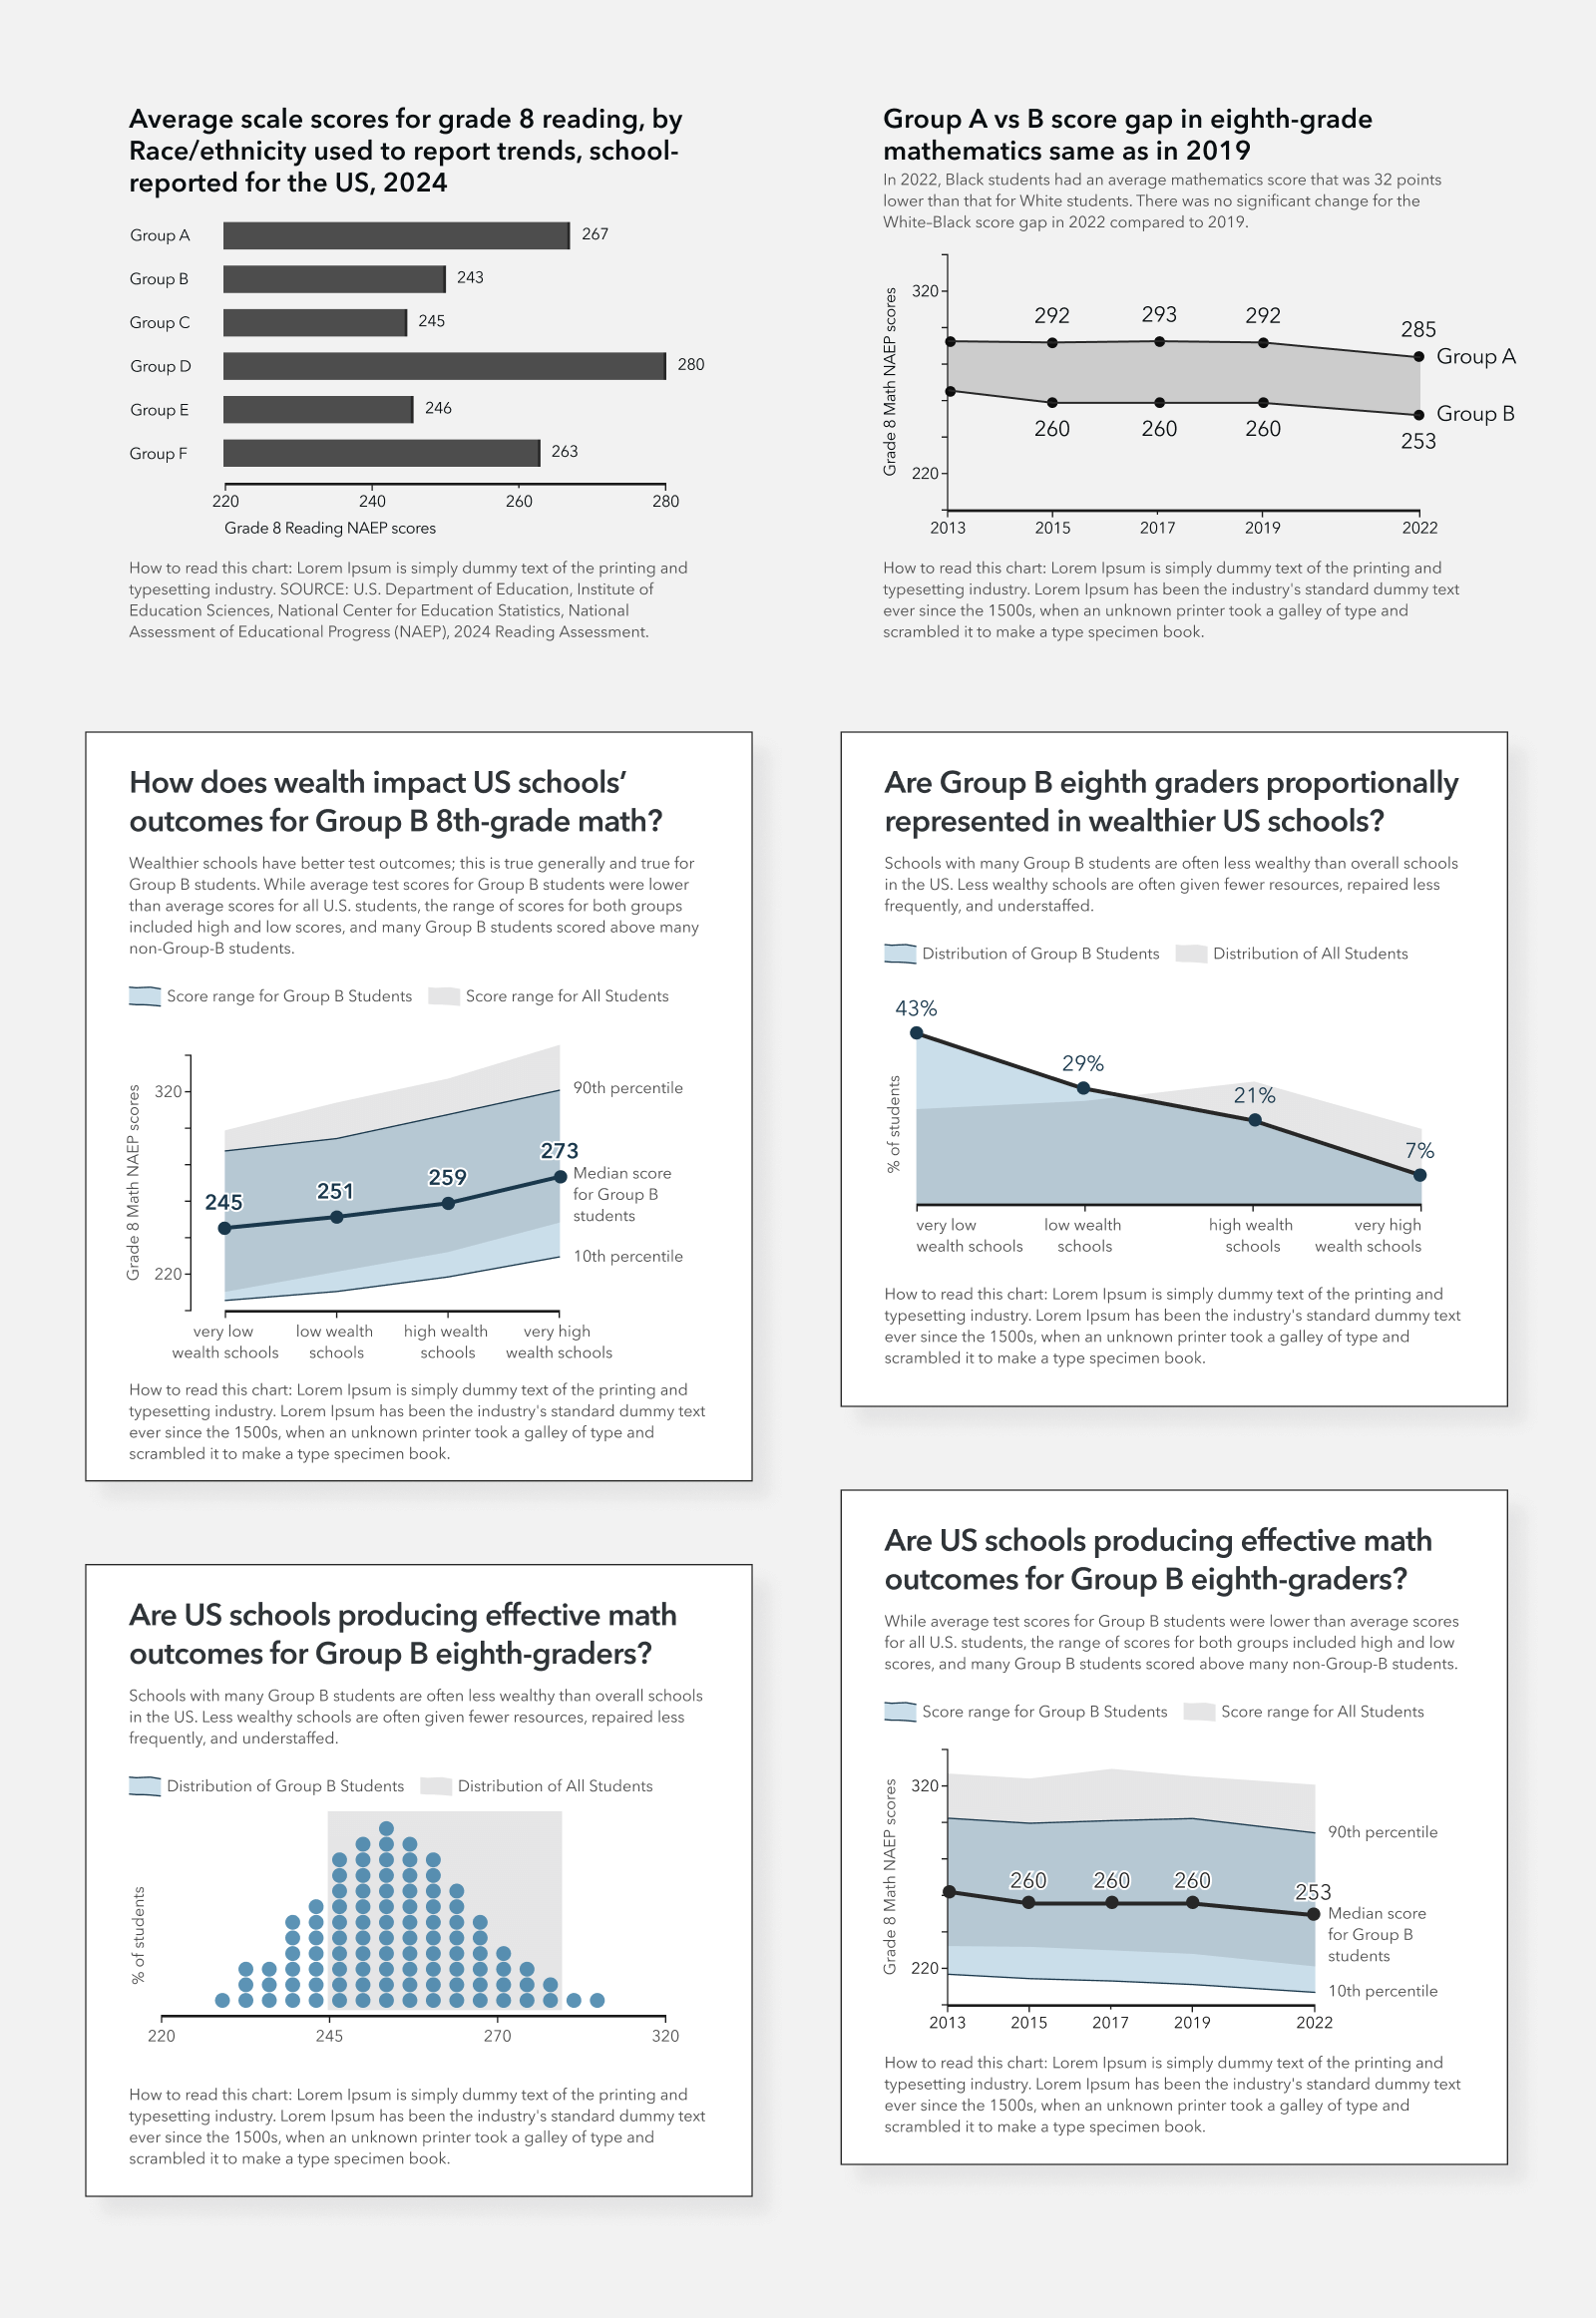
Group-level achievement data are often shown using conventional charts like the above. Sometimes they’re bar charts, contrasting average outcomes between groups (left). Other times they’re timeseries, highlighting the contrast between two groups (right).
By fixating viewers on the differences between groups, charts like these can be dangerously misleading, misrepresenting the underlying causes of outcome differences and the student groups being visualized (Holder & Xiong 2022, Gutiérrez 2008). These misbeliefs have troubling implications not only for students, but also in undermining successful education policy (Holder & Blakely, Metzyl 2019).
3iap’s research was actually the first to empirically demonstrate this biased interpretation for data visualizations, which you can read more about here: Unfair Comparisons.
Our research shows how these biases are influenced by design choices. For example, bar charts like the above, which hide variability within groups, tend to make these biases worse. On the other hand, charts like jitter plots and histograms show full distributions of data, emphasizing within-group variability and between group overlap; these more expressive charts can actually correct some of the bias, reducing the risk of misattributions and misrepresentations (Holder & Padilla 2024).
Goals
3iap’s collaboration with ETS focused on uncovering new charts, intentionally designed for visualizing group-level education outcomes while minimizing social-cognitive biases.
Specifically, we were exploring alternative designs aligned with the following goals:
- NAEP Score charts should meet basic standards of clarity and approachability for The Report Card’s original communication goals. They need to clearly present group-level test scores.
- The charts should minimize misleading biases by applying 3iap and others’ research into clearer social outcome reporting.
- The charts need to be practically useful for education analysts, school administrators, and education policymakers.
Approach
Guided Codesign
While our research-backed design principles are a great first step, there’s still a big gap between principles and producing viable designs that are ready for a big platform like The Nation’s Report Card.
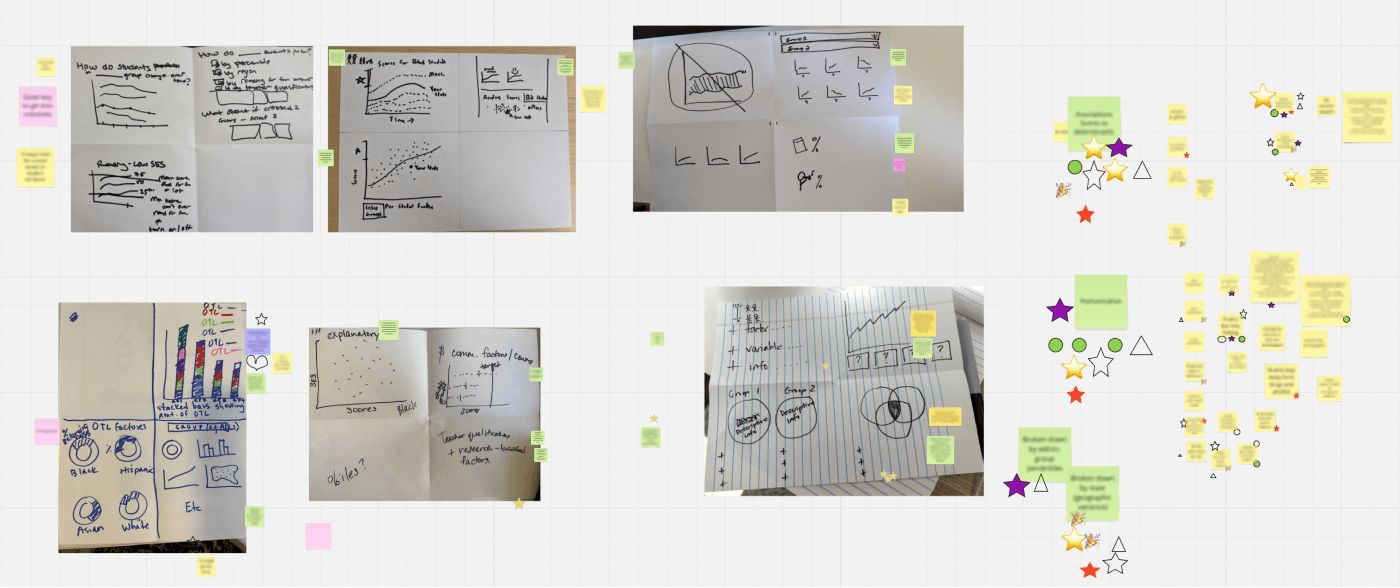
Resilient Designs: A guided codesign process can be a reliable way to develop designs that not only build on research and best practices, but that also meet practitioners’ other communication goals and adapt to their specific contexts. The key is how this collaborative process helps surface a) a wider set of constraints and considerations, b) from a more diverse set of perspectives, c) as early in the process as possible. Getting as many of these ideas out of people’s heads and onto paper makes it easier to manage critical design tradeoffs and ultimately reach more optimal solutions.
Learning By Doing: In addition to producing better designs, codesign also helps teams learn and adopt more effective design practices. While workshops are helpful for introducing research and design guidelines, there’s nothing like hands-on experience for learning something new. This is particularly true when the material is unintuitive or challenges entrenched conventional wisdom.
Decision Alignment: Codesign also promotes organizational alignment and cohesive decisionmaking. By actively participating in the design process, everyone involved has a more intimate understanding of important tradeoffs, making it easier to ultimately align around important decisions.
3iap partnered with ETS researchers on three main areas:
- Design training and data-design expertise. This ranged from early training sessions for participants, to targeted insights related to specific codesign sessions, to ongoing feedback and consulting on more general best practices for effective data communication.
- Facilitated design exercises. These helped codesign participants to articulate a diverse set of needs, as well as to brainstorm and prioritize viable alternative solutions.
- Design research consulting. As ETS researchers planned further studies, 3iap supported ongoing research efforts, contributing to literature reviews, instrument exploration, and experiment design tradeoffs for empirically validating candidate designs.
Codesign Insights
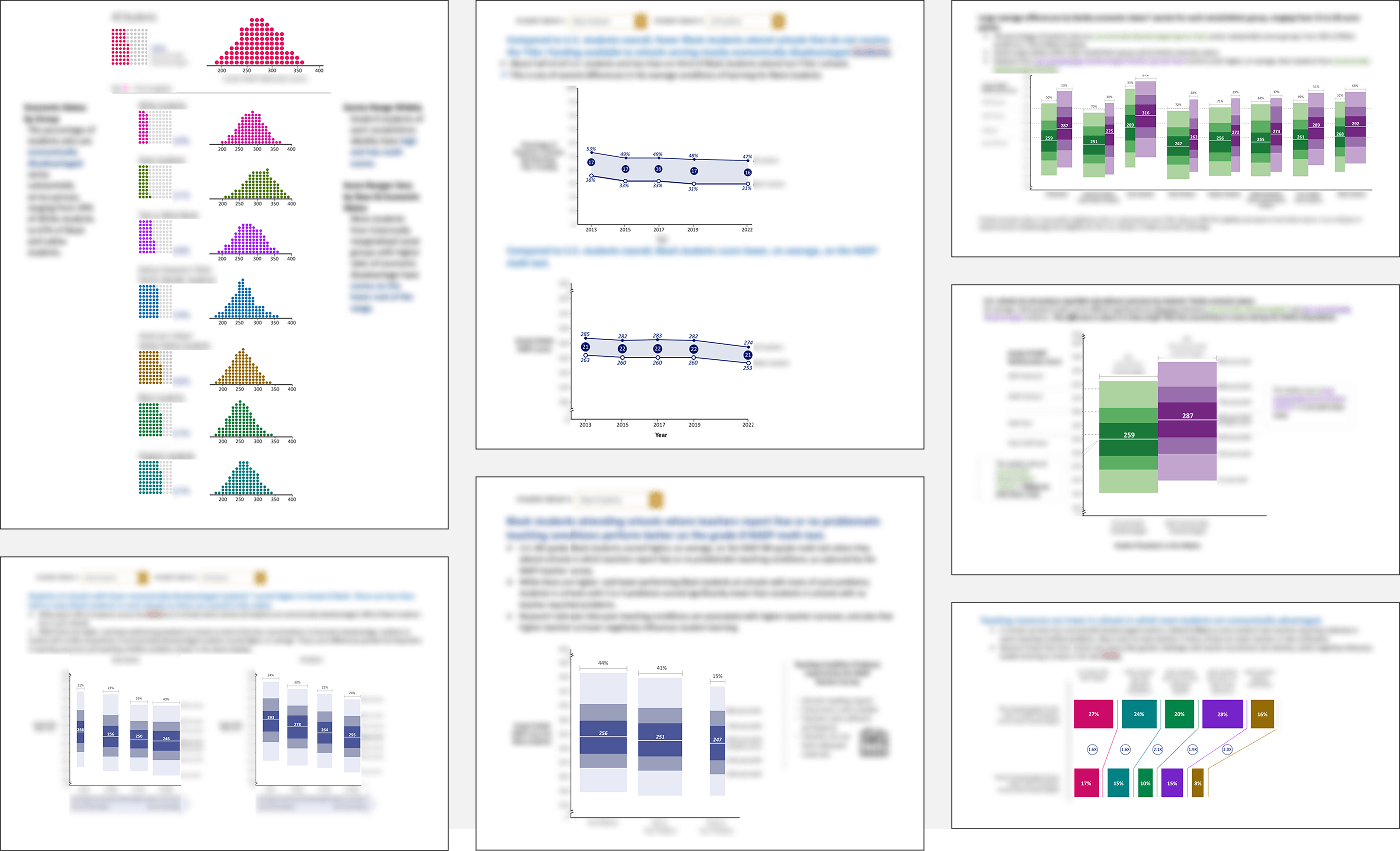
What was remarkable about the codesign process was how, even though it was open-ended and group-driven, the final designs converged around a set of powerful, research-backed design principles, each leaning into complementary theories of action.
- Emphasizing within-group variability. This was a key insight from 3iap’s studies: Outcome charts can minimize misattributions and misrepresentations by emphasizing within-group variability (and highlighting between-group overlap).
- Minimizing inter-group comparisons. A number of research threads suggest that any amount of inter-group comparisons might be problematic. And from a design perspective, they’re also not necessary for communication goals. For example, to report on outcomes for rural students, there’s actually no hard reason to compare their outcomes to those of urban or suburban students: Comparisons to population means or universal goals convey the same information, with less risk of side effects.
- Causal explainability. Every analyst knows that “correlation doesn’t imply causation.” But the “illusion of causality” is a surprisingly common bias when interpreting data, and it’s closely related to issues like misattribution. When we mistakenly blame individuals for bad outcomes, it’s because we’re overlooking the more complex and diffuse upstream causes like school funding differences and neighborhood-effects. Many of the designs attempt to correct for this by subtly priming other plausible influences for the visualized outcomes.
Results
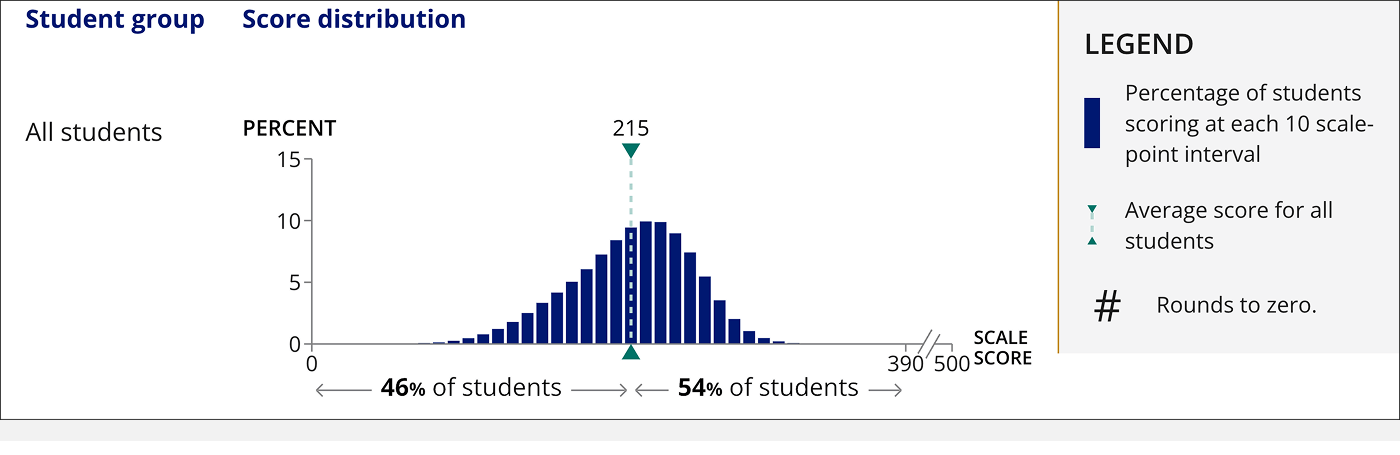
We changed reporting The Nation’s Report Card. The National Center for Educational Statistics (NCES) heard what we were doing and adopted many of our most critical ideas. In their most recent launch of The Nation’s Report Card website, they present 2024 NAEP group-level test scores with small multiple histograms that emphasize within-group variability, minimize inter-group comparisons, and include group identity in line with a variety of other (more relevant) factors like socioeconomic status. They’ve also removed references to “achievement gaps” and related plots.
Our codesign study was accepted at NCME. The brilliant team at ETS submitted the codesign study to the National Council on Measurement in Education (NCME). We were accepted and presented together as a panel at the 2025 Annual Meeting in Denver.